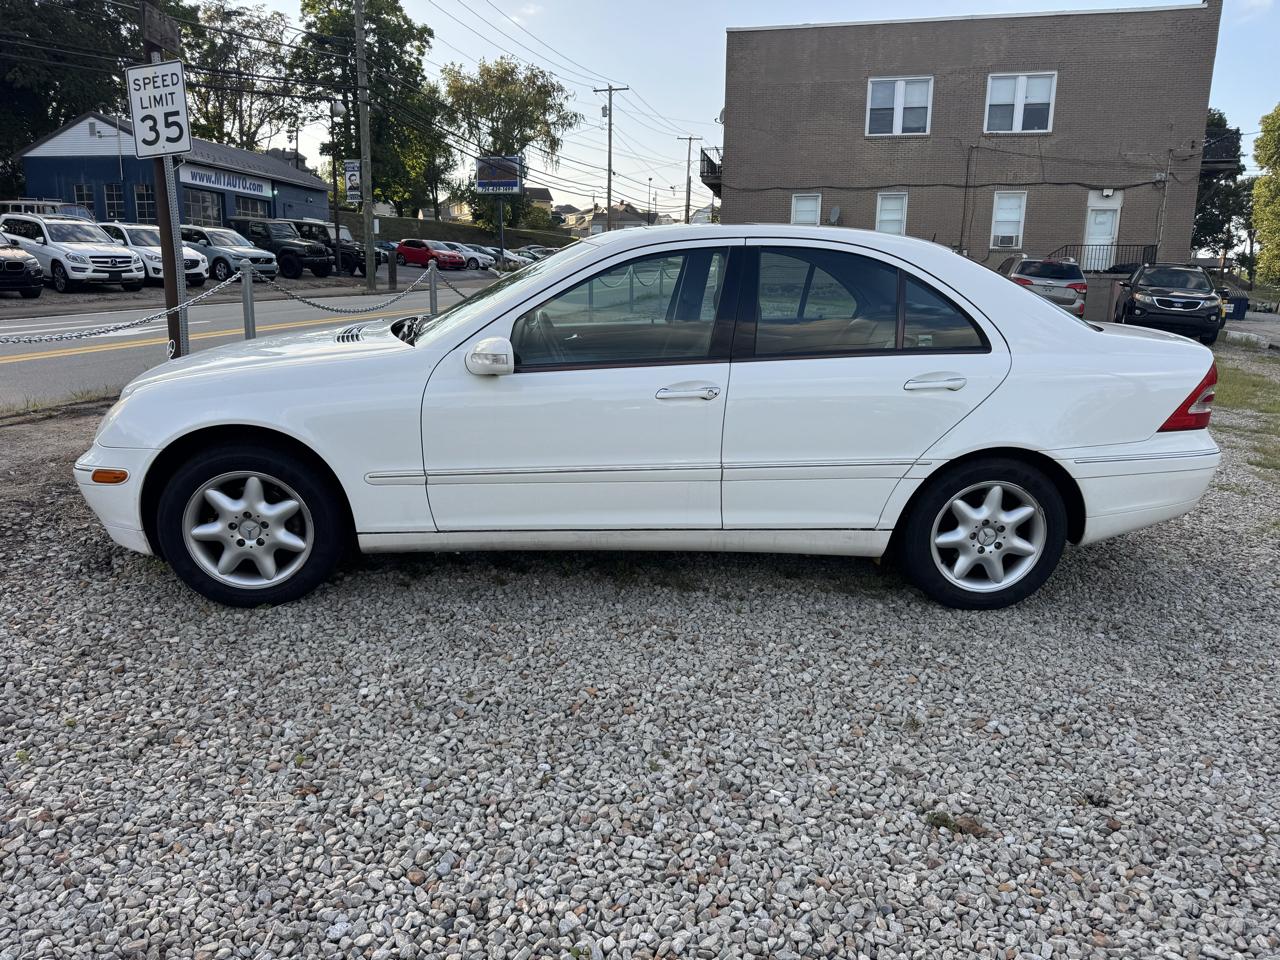
2002 Mercedes-Benz C-Class C240 Sedan
$2,999est. $52/mo
- 116,124 mi
- RWD
- Automatic
- Gasoline
- Car
Preowned Auto Sales · Uniontown, PA
What dealers are asking for the Mercedes-Benz C-Class right now, from 4,452 current listings at 1,664 dealerships across 49 states, with government facts for each model year.
Asking prices of current listings · AutosXchange live dealer listings, November 17, 2026 · not sold prices
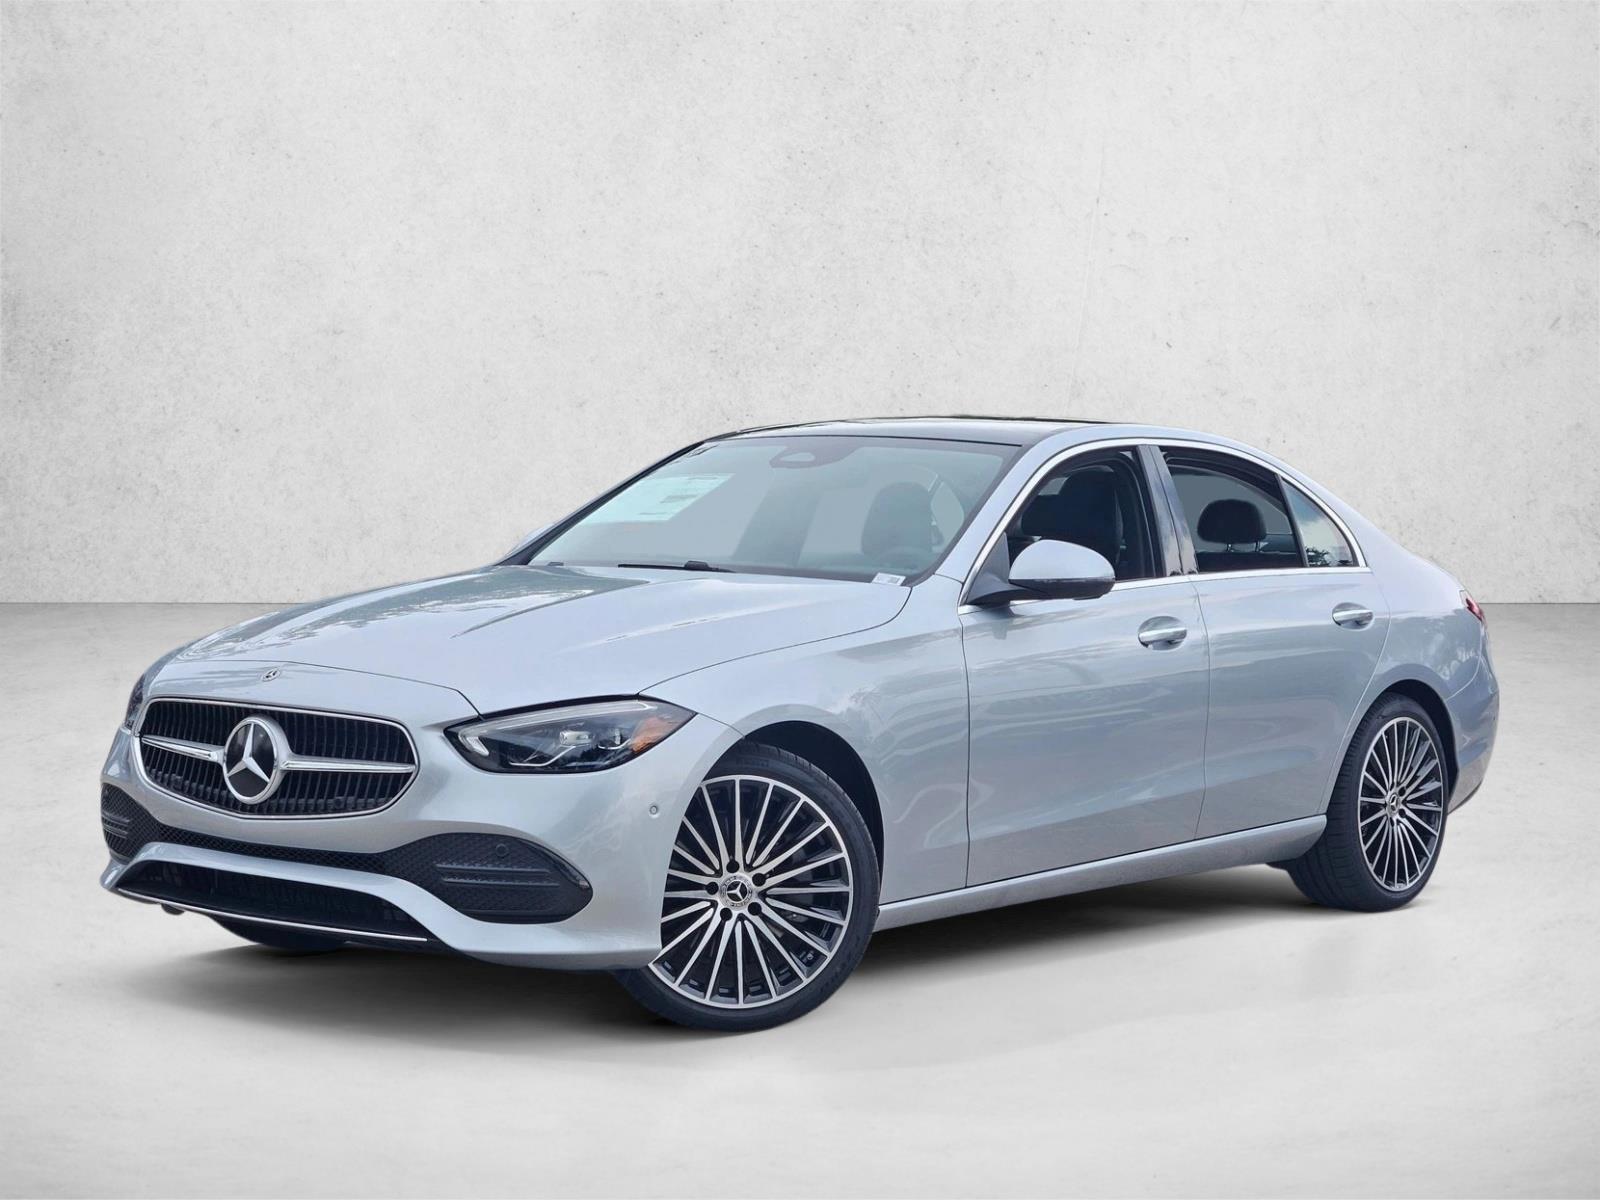
AutosXchange lists the Mercedes-Benz C-Class across 32 model years, from 1994 to 2027. Government data for the 2 model years we track (2026–2027) describes it as a sedan offered with hybrid powertrains. EPA combined ratings range 22–29 MPG. 4,452 are listed now, with a median asking price of $35,865 and median 22,581 miles.
| Model year | Listed | Median asking | EPA combined | NHTSA overall (best) | Recalls |
|---|---|---|---|---|---|
| 2027 C-Class | 628 | $57,130 | 27–29 MPG | — | 0 |
| 2026 C-Class | 1,283 | $55,407 | 22–29 MPG | — | 0 |
| 2025 C-Class | 144 | $37,927 | — | — | — |
| 2024 C-Class | 217 | $35,444 | — | — | — |
| 2023 C-Class | 241 | $33,549 | — | — | — |
| 2022 C-Class | 116 | $29,608 | — | — | — |
| 2021 C-Class | 98 | $24,549 | — | — | — |
| 2020 C-Class | 109 | $22,994 | — | — | — |
| 2019 C-Class | 185 | $18,995 | — | — | — |
| 2018 C-Class | 196 | $16,992 | — | — | — |
| 2017 C-Class | 210 | $15,495 | — | — | — |
| 2016 C-Class | 164 | $12,995 | — | — | — |
| 2015 C-Class | 189 | $12,008 | — | — | — |
| 2014 C-Class | 131 | $8,500 | — | — | — |
| 2013 C-Class | 147 | $8,550 | — | — | — |
| 2012 C-Class | 96 | $7,987 | — | — | — |
| 2011 C-Class | 60 | $7,735 | — | — | — |
| 2010 C-Class | 44 | $7,995 | — | — | — |
| 2009 C-Class | 46 | $6,995 | — | — | — |
| 2008 C-Class | 36 | $6,418 | — | — | — |
| 2007 C-Class | 22 | $5,125 | — | — | — |
| 2006 C-Class | 21 | $4,995 | — | — | — |
| 2005 C-Class | 13 | $5,495 | — | — | — |
| 2004 C-Class | 12 | $5,948 | — | — | — |
| 2003 C-Class | 17 | $4,997 | — | — | — |
Half of the 4,452 listings ask between $14,999 and $55,129.
Median asking price runs from $6,995 for 1996 models to $57,130 for 2027 models, about $1,507 more per newer model year on average.
On the trend line, every 10,000 more miles goes with about $3,800 lower asking price.
Half of listings ask between $14,999 and $55,129; the most common band is $55,000–$60,000 (722 listings).
California has the most, with 1,063 listings (24% of 4,452).
C is the most-listed trim (3,077 listings); Base has the highest median asking price of these, $54,768.
Preowned Auto Sales · Uniontown, PA

Goleta Motors · Goleta, CA

Highlight Motors · Linden, NJ

M2 Auto Group Llc. EAST BRUNSWICK · East Brunswick, NJ

PRIME AUTO PLUS INC. · Daytona Beach, FL

EAGLE CARS USA LLC · Orlando, FL

KING AUTO SALES II - KING AUTO SALES II · Detroit, MI

Cadillac of Jackson · Ridgeland, MS
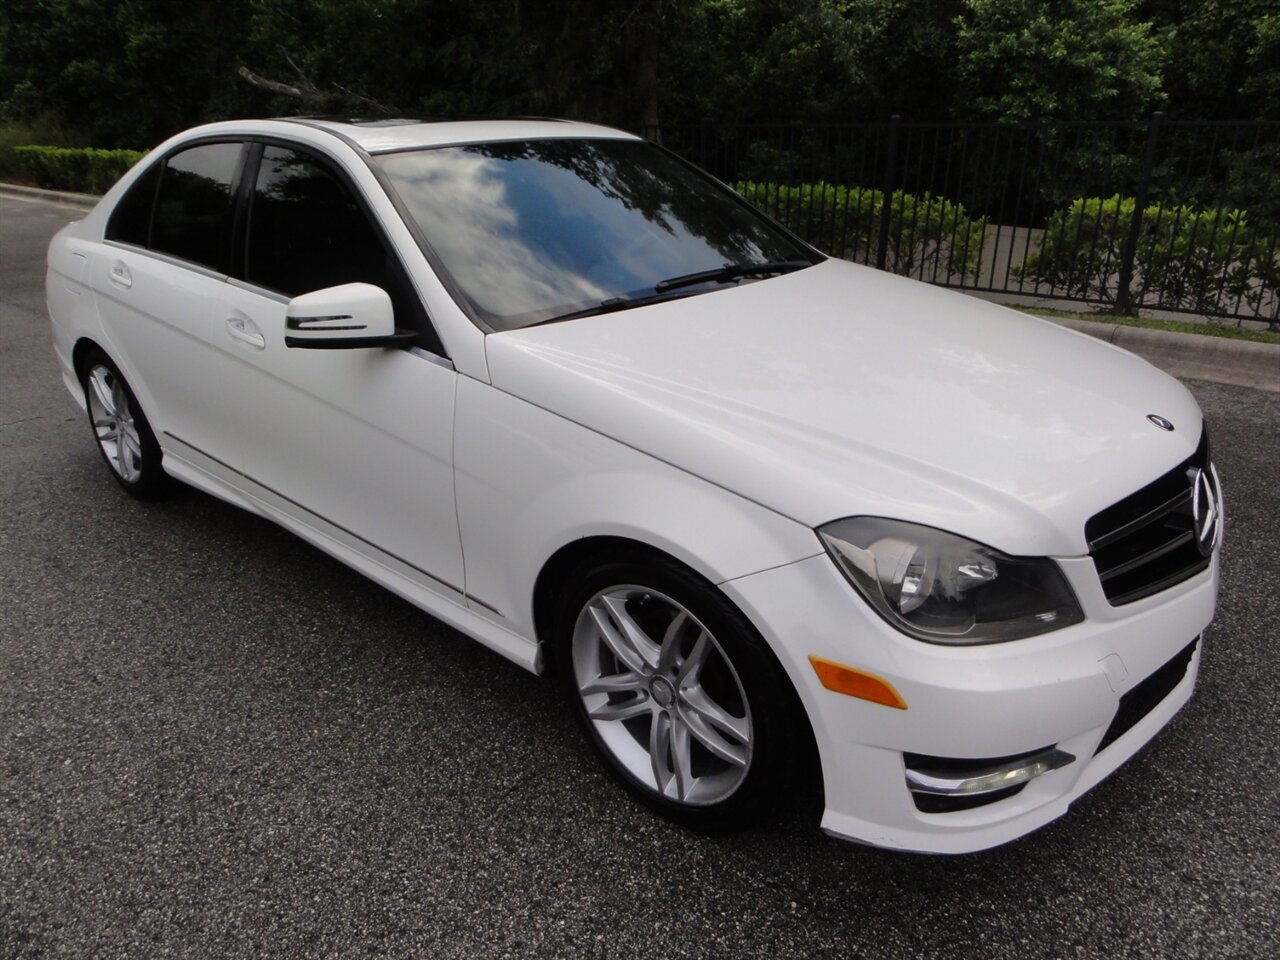
VARIETY AUTO GROUP, LLC · Deland, FL

ACH AutoHaus · Dallas, TX
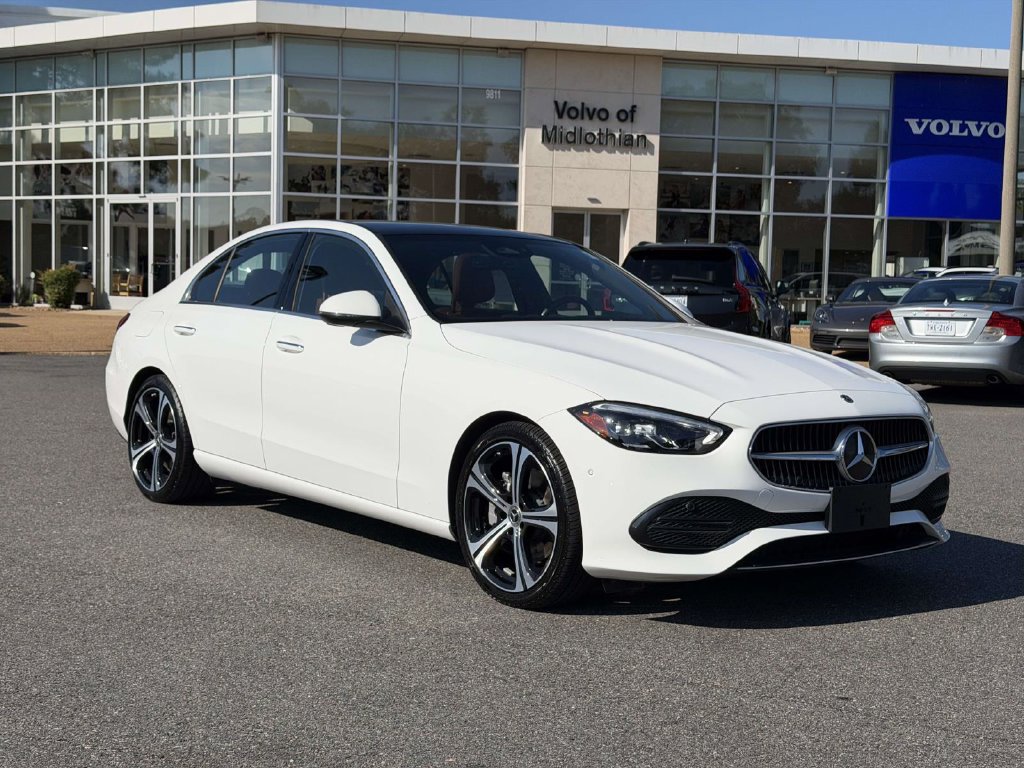
Volvo Cars Midlothian · Midlothian, VA

Modern Auto · Phoenix, AZ

Silver Star Motorcars · Dallas, TX

Lake Auto Sales · Hartville, OH

Auto Boutique Texas · Alvin, TX

Husker Auto Group · Lincoln, NE
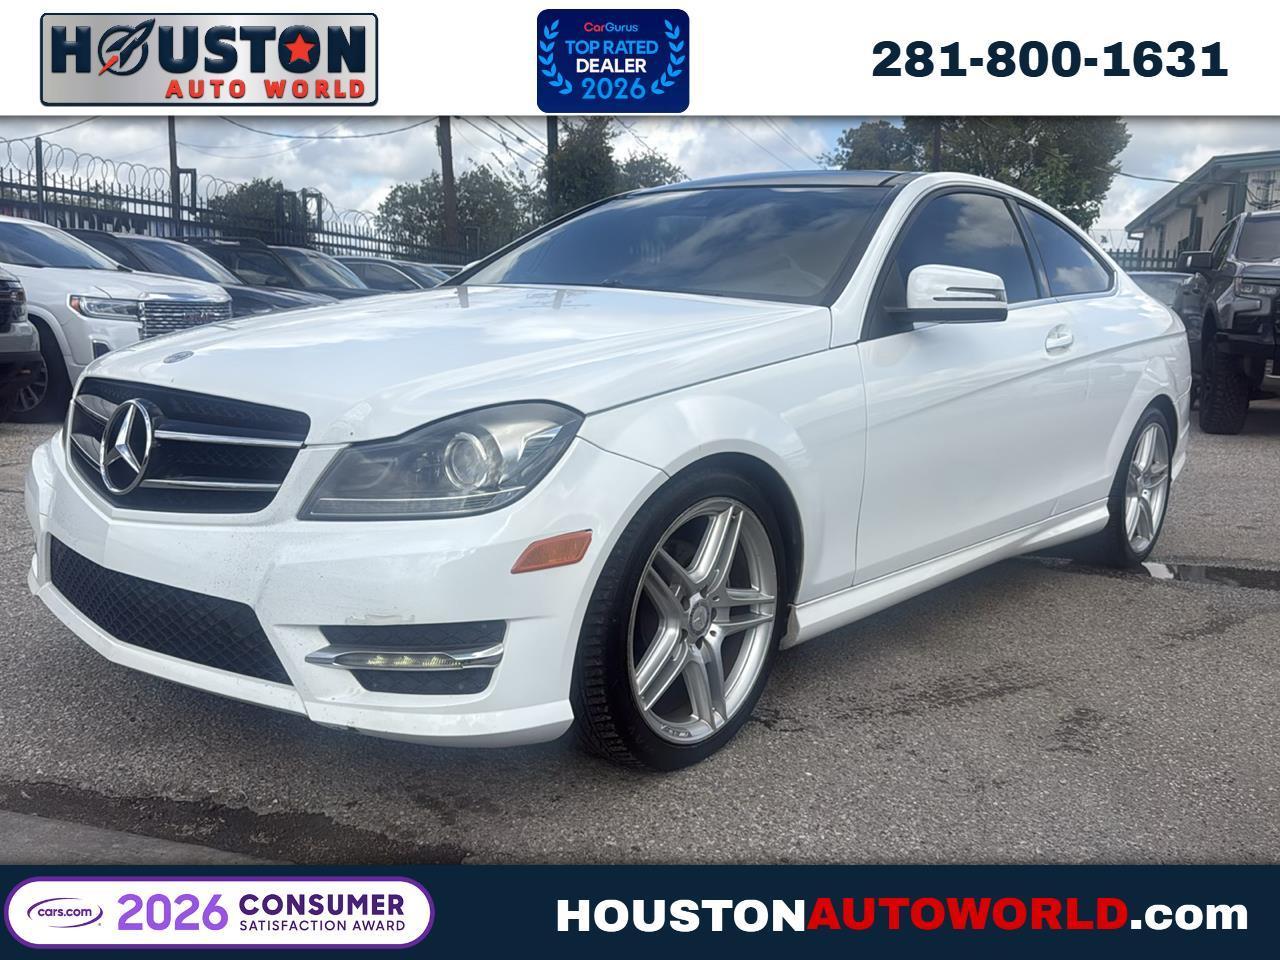
Houston Auto World · Houston, TX

ICars Imports · Fairfiled, OH
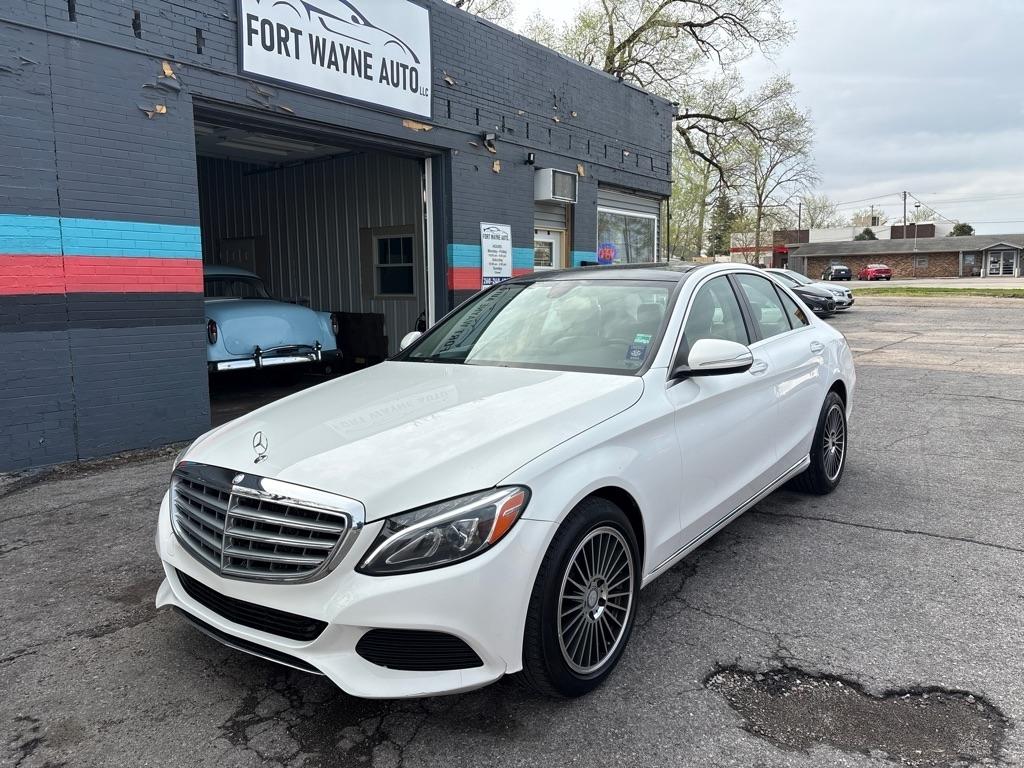
Fort Wayne Auto LLC · Fort Wayne, IN

York Auto Sales LLC · Lincoln, NE

All Will Drive Motors · Davie, FL

VALERIO'S AUTO SALES INC · Montgomery, AL

NOAHS AFFORDABLE MOTORS · Tracy, CA

Express AutoPlex · Brownsville, TX
Market value (30 days): $35,292, based on 4,477 cars for sale now and 506 last listed prices. Last listed price is the final advertised price of a listing before it was removed from sale, like a stock's last traded price. Market value is the median of last listed prices (listings removed in the window) together with current asking prices.
7-day window, 7 days. Latest: market value based on 4,477 cars for sale now and 475 last listed prices. One point per day; lines are smoothed curves through the daily values.
30-day window, based on 12 days of tracking since Nov 5, 2026. Latest: market value based on 4,477 cars for sale now and 506 last listed prices. One point per day; lines are smoothed curves through the daily values.
90-day window, based on 12 days of tracking since Nov 5, 2026. Latest: market value based on 4,477 cars for sale now and 506 last listed prices. One point per day; lines are smoothed curves through the daily values.
Only verified listings count (data-integrity checks); removals from a dealer's feed or website change, and cars still listed at another dealer, are not last listed prices.
Tracked daily since Nov 5, 2026; data as of Nov 16, 7:25 PM PST. ▲ ▼ show the direction of change.
Since Nov 5: 14.8% of 5,272 listings cut (average $863), 831 new, 526 removed from sale.
| Location | Listings | Median asking | vs. national | Cut in 7 days | Avg cut | Same cars, 7-day change | New / removed 7d |
|---|---|---|---|---|---|---|---|
| United States | 4,504 | $35,862 | — | 13.9% | $818 | ▼ −1.3% | 730 / 493 |
| The South | 1,909 | $35,249 | ▼ −1.7% | 13.9% | $862 | ▼ −0.9% | 239 / 199 |
| The West | 1,374 | $52,217 | ▲ +45.6% | 11.3% | $835 | ▼ −0.1% | 311 / 172 |
| The Northeast | 619 | $29,990 | ▼ −16.4% | 18.2% | $859 | ● −0.0% | 101 / 59 |
| The Midwest | 601 | $25,075 | ▼ −30.1% | 15.1% | $565 | ▼ −1.3% | 79 / 63 |
| The South Atlantic states | 1,386 | $38,844 | ▲ +8.3% | 13.2% | $871 | ● 0.0% | 183 / 142 |
| The Pacific states | 1,201 | $52,772 | ▲ +47.2% | 10.2% | $834 | ● 0.0% | 289 / 138 |
| The East North Central states | 460 | $26,162 | ▼ −27.0% | 15.4% | $571 | ▼ −1.0% | 57 / 48 |
| The Middle Atlantic states | 408 | $30,170 | ▼ −15.9% | 16.5% | $931 | ▲ +0.5% | 85 / 45 |
| The West South Central states | 372 | $25,990 | ▼ −27.5% | 17.1% | $825 | ▼ −2.3% | 41 / 46 |
| The New England states | 211 | $29,074 | ▼ −18.9% | 22% | $671 | ● −0.0% | 16 / 14 |
| The Mountain states | 173 | $20,641 | ▼ −42.4% | 19.2% | $837 | ▼ −0.3% | 22 / 34 |
| The East South Central states | 151 | $27,442 | ▼ −23.5% | 13.2% | $892 | ● 0.0% | 15 / 11 |
| The West North Central states | 141 | $22,535 | ▼ −37.2% | 14.3% | $546 | ● 0.0% | 22 / 15 |
| California | 1,062 | $52,935 | ▲ +47.6% | 9.5% | $864 | ● 0.0% | 274 / 124 |
| Florida | 814 | $53,837 | ▲ +50.1% | 13.5% | $875 | ● 0.0% | 113 / 88 |
| Texas | 303 | $30,999 | ▼ −13.6% | 18.6% | $825 | ▼ −0.5% | 33 / 45 |
| Illinois | 170 | $31,995 | ▼ −10.8% | 16.6% | $604 | ● 0.0% | 26 / 20 |
| Maryland | 158 | $48,400 | ▲ +35.0% | 12.5% | $1,035 | ● 0.0% | 32 / 11 |
| New Jersey | 155 | $29,998 | ▼ −16.4% | — | — | ● 0.0% | — |
| Ohio | 155 | $29,064 | ▼ −19.0% | 13.8% | $570 | ● +0.0% | 15 / 12 |
| Georgia | 139 | $15,995 | ▼ −55.4% | 14.5% | $958 | ● 0.0% | 8 / 20 |
| Massachusetts | 133 | $29,900 | ▼ −16.6% | 24.6% | $566 | ● 0.0% | 6 / 9 |
| Pennsylvania | 131 | $31,241 | ▼ −12.9% | 12.5% | $685 | ▼ −0.3% | 48 / 10 |
| Houston, TX | 38 | $14,725 | ▼ −58.9% | 10.9% | $451 | ● 0.0% | 5 / 8 |
| Jacksonville, FL | 34 | $31,077 | ▼ −13.3% | 28.6% | $543 | — | 11 / 7 |
| Dallas, TX | 25 | — | — | 16.1% | $890 | — | 3 / 6 |
What this means for you: The typical Mercedes-Benz C-Class asking price stayed within 1% over the last 7 days.
Method terms: "same cars" is the median asking price of the same listings on both dates (a same-store median), so changes in the mix of cars do not move it; a "model" is a model year, make and model with at least 30 listings from 5 dealers (a cohort); a "group of states" is a U.S. Census division.
134 cuts and 45 raises in the last 30d; median cut −2.9%.
Showing the latest 10 of 179 · scroll the list
Source: AutosXchange Intel Hub, autos-xchange.com/market, 2026-11-17.
AutosXchange market data is calculated from the asking prices of current dealer listings on AutosXchange, refreshed as dealers update their inventory. These are not sold or transaction prices and not appraisals. Listings with an asking price under $500 (placeholder prices) are excluded. Confirm price, fees and availability with the selling dealer.